|
|
|
Our Tech Examples Applications FAQ Index Sales
|
|
|
Relevance Spectroscopy -Hyperspectral Image Interpretation |
|
With the increasing availability of multispectral and hyperspectral imagery it is important to know which of the many spectral
bands are most useful for differentiating a specific set of classes of interest in a scene.
Such knowledge can dramatically decrease the transmission and processing bandwidth required for
image interpretation.
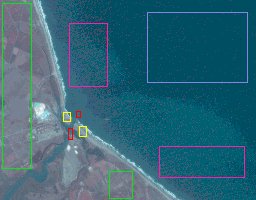
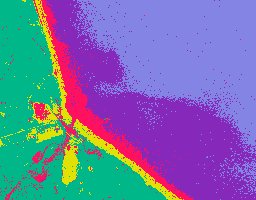
We have recently been awarded US Patent 8,918,347 for an automated method of rapidly determining an optimum combination of available sensor variables to differentiate any particular set of target classes. This method, which we refer to as relevance spectroscopy has been demonstrated by experimental studies on suites of multispectral and hyperspectral images collected by satellites, aircraft and laboratory systems. The resulting optimum image combination is suitable for analysis by traditional and/or our proprietary maximum likelihood methods. The upper image was created from a set of three monochrome images automatically chosen from a set of over two hundred simultaneously collected by a NASA aircraft over Monterey Bay, California. (South is towards the top.) Each image represents a different spectral band. For this test the band combination was chosen to optimize differentiation of certain water and shoreline classes while suppressing differentiation of land vegetation classes. Training regions for each class are outlined by the red, yellow, purple, and blue rectangles with each color representing a different class. Note how land vegetation regions are combined into a single class whose training regions are outlined by the green rectangles. The resulting WAY-2C classification interpretation is shown in the lower image. If the objective had been to distinguish a variety of land-based vegetation classes a different training set would have been used and, as a result, the system would have selected a different set of spectral bands. Note that, even though the training regions for two of the water classes each contain some of the other class, the interpretation itself has properly classified these regions consistent with our perception. On the other hand, there is a light colored land area in the middle left of the image which was neither included in any of the training regions nor resembles any of them. With no training information to go on, the system has chosen to classify much of this area as stream effluent, the class having the minimum mismatch in the bits used for the classification. |
|
|
|
For more information: |
For more information on remote sensing imagery analysis.
Back to "Other WAY-2C Applications" For licensing inquiries contact Robert McConnell
Last Updated 9/07/16