|
|
|
Our Tech Examples Applications FAQ Index Sales
|

|
Remote Sensing Image Analysis |
||
|
WAY-2C's classification and anomaly detection capabilities permit rapid interpretation of images of all kinds without the need for additional algorithm selection and/or development. This makes it particularly well suited for flexible real-time interpretation of images from satellites and surveillance aircraft.
Automated ClassificationFor example, to generate a classification map from a satellite image the analyst simply:
|
|||
 |
 |
||
|
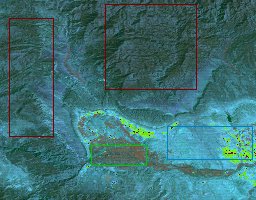
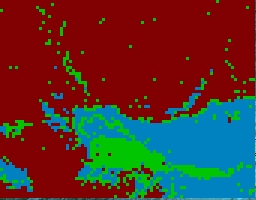
In the example above the classes chosen by the analyst were "mountain vegetation", " valley vegetation", and
"grassland".
Training regions are shown above left, superimposed on the original image. The mountain vegetation training
regions are outlined in red, the valley vegetation training region in green, and the grassland training region
in blue. Interpretation results are shown in the image on the right. Resolution in this example is 3x3 pixels.
Typical analyst-assisted training time is on the order of a minute and interpretation time well
under a second on a personal computer. Note that the class designated as grassland by the analyst contains three distinct groups of colors: blue-gray, yellow, and red in the original image. In other words the grassland color distribution is multimodal with color frequency peaks being widely separated in color space. In spite of this, WAY-2C has had no difficulty interpreting each of these colors as belonging to the same class. Counters for each class for each region, each image and all images are maintained and available for real-time and/or later decisions. In applications in which images are available from more than three spectral bands or sensor types, we have developed an automated method of rapidly determining the optimum combination of sources to differentiate any particular set of target classes. This patented method, which we refer to as relevance spectroscopy, has been demonstrated by experimental studies on suites of hyperspectral images from a variety of satellites, NASA aircraft and other image sources.
|
|||
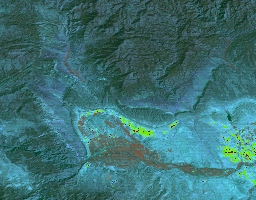
Anomaly DetectionSometimes, including search and rescue, and military surveillance operations, it can be important to call the observer's attention to locations where the spectral data (color) is anomalous with respect to the distribution characteristic of part or all of the entire image. The WAY-2C search mode can rapidly perform find such locations usually without training or other intervention by a professional analyst.Such a "global" anomaly map is shown on the right immediately below. In it gray indicates regions whose anomalousness index, with respect to the entire image, is less than an operator selected threshold. Blues through greens, yellows, reds, to black indicate regions of increasing anomalousness. Complete training and interpretation time for this map is well under a second on a personal computer. |
|||
 |
 |
||
| Note that the global anomaly map shows some border regions of the valley vegetation, and the yellow and red grassland regions as anomalous because of their relative rarity in the total scene. To eliminate such effects one can incorporate automatic classification results into the anomaly interpretation. | |||
|
|
 |
||
|
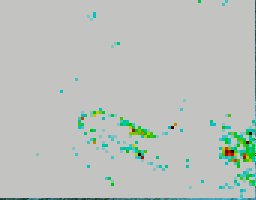
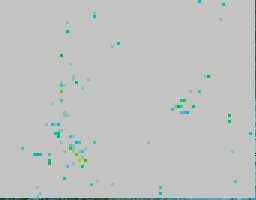
The map on the lower right shows the results of incorporating automatic classification results into the
anomaly interpretation. It shows the degree of anomalousness with respect to best fitting class at each
location. Note that most of the locations identified as anomalous in the global interpretation have
disappeared allowing the observer to focus on a comparatively few sites, particularly those shown in yellow. As in the case of classification, counters for each region, each image and all images are maintained and available for real-time and/or later decisions.
|
|||